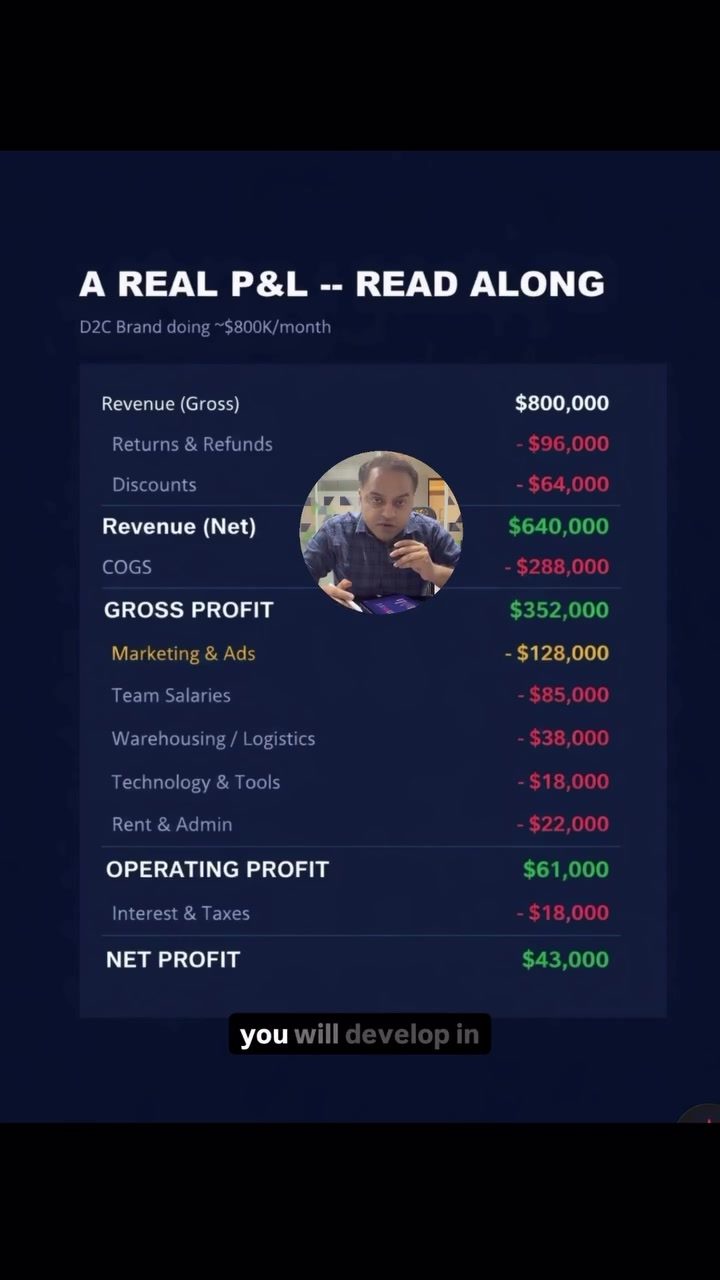
Financial P&L Breakdown for Marketers
Understanding a financial profit and loss (P&L) statement is a crucial skill for marketers. This breakdown provides insights into the financial health of a business, helping marketers make informed decisions and contribute to overall business strategy. Here, we dive into the essential components of a P&L statement from a marketing perspective, focusing on key metrics and benchmarks.
Why This Matters
As a marketer, having a solid grasp of financials can make a significant difference. It helps in aligning marketing strategies with business goals, ensuring that every marketing dollar spent contributes to the bottom line. This understanding becomes even more critical when budgeting, forecasting, and analyzing the financial performance of various marketing channels. By reading a P&L, marketers can gauge the effectiveness of their strategies and make data-driven decisions.
Key Metrics in a P&L Statement
Gross Revenue
Gross revenue is the total amount of money a business generates from sales. For a direct-to-consumer (D2C) brand, this might include sales from online platforms, physical stores, or other channels. Let's consider a D2C brand doing around $800,000 in a month. This number is crucial as it reflects the overall revenue target and is typically reported in ad accounts like Meta and Google.
Returns and Refunds
Returns and refunds are deducted from gross revenue to arrive at net revenue. In the example, returns and refunds amount to $96,000. These figures are important for marketers because returns and refunds can indicate customer satisfaction and the effectiveness of the marketing message in setting realistic expectations. High return rates might suggest a need to adjust marketing strategies or product offerings.
Discounts
Discounts also affect the net revenue. If the brand offers $64,000 worth of discounts, this reduces the net revenue. Marketing plays a direct role in determining discount strategies. Effective promotional campaigns and discounts can drive sales, but they also impact the bottom line. Marketers must balance the need for customer acquisition and retention with the financial implications of discounts.
Cost of Goods Sold (COGS)
COGS represents the direct costs associated with creating or acquiring the products sold. For our example, COGS is $288,000. This figure is crucial for understanding the cost efficiency of the production process and for pricing strategies. Lower COGS can translate into higher profit margins, giving marketers more flexibility in promotional activities and pricing.
Gross Profit
Gross profit is calculated by subtracting COGS from net revenue. If the net revenue is $640,000 and COGS is $288,000, the gross profit is $352,000. Gross profit indicates the efficiency of production and the effectiveness of the sales and marketing strategies. A higher gross profit margin allows for more investment in marketing initiatives.
Operating Expenses
Operating expenses include all the costs associated with running the business, excluding COGS. These can vary widely but typically include:
- Marketing and Advertising: For our D2C brand, marketing expenses are $128,000. This includes all promotional activities, advertising spend, and other marketing-related costs.
- Team Salaries: Salaries for the marketing team and other employees can amount to $85,000.
- Warehousing and Logistics: Warehousing and logistics costs are $38,000.
- Technology and Tools: Technology expenses, including software and hardware, are $18,000.
- Rent and Admin: General administrative costs and rent amount to $22,000.
By carefully managing these expenses, marketers can ensure that the business remains profitable and sustainable.
Operating Profit
Operating profit is the profit generated from core business operations after deducting operating expenses from gross profit. In our example, the operating profit is $61,000. This metric is essential for understanding the overall efficiency of the business operations and marketing efforts.
Interest and Taxes
Interest and taxes are deducted from the operating profit to arrive at net profit. In this case, interest and taxes amount to $18,000, leaving a net profit of $43,000. Marketers must be aware of how interest rates and tax policies can impact the bottom line, as these can influence budgeting and financial planning.
Marketing Spend Benchmarks
Marketing spend as a percentage of net revenue is a critical metric for marketers. Benchmarks can vary across different industries:
- Maturity to see: 12–18%
- SaaS B2B: 15–25%
- SaaS B2C: 20–35%
- E-commerce: 8–15%
- Services or consulting business: 5–12%
- Education businesses: 15–25%
Knowing these benchmarks helps marketers align their spending with industry standards, ensuring that resources are allocated effectively and that marketing efforts are contributing positively to the bottom line.
Practical Tips for Marketers
Master the P&L Statement
Familiarize yourself with the P&L statement and understand how each line item affects overall profitability. Regularly review financial reports to stay informed about the financial health of the business and the impact of marketing initiatives.
Align Marketing Strategies with Financial Goals
Ensure that your marketing strategies are aligned with the financial goals of the business. This includes setting realistic revenue targets, managing costs effectively, and optimizing marketing spend to maximize return on investment (ROI).
Analyze Marketing ROI
Regularly analyze the ROI of your marketing efforts. Track key performance indicators (KPIs) such as customer acquisition cost (CAC), customer lifetime value (CLTV), and return on ad spend (ROAS). Use this data to inform budgeting and forecasting decisions.
Communicate Effectively with Finance Teams
Develop a strong working relationship with the finance team. Understanding their needs and concerns can help in making more informed decisions and developing more effective budgeting and forecasting strategies.
Stay Updated on Industry Benchmarks
Stay informed about industry benchmarks for marketing spend. This knowledge can help in optimizing budgets and ensuring that marketing investments are in line with industry standards.
Develop Financial Literacy
Invest in professional development opportunities that enhance your financial literacy. Courses and workshops focused on finance for marketers can provide valuable insights and skills. This can help you make better-informed decisions and contribute more effectively to the financial health of the business.
Important Takeaways
Understanding the P&L statement is essential for marketers to make informed decisions and contribute to the overall success of the business. By familiarizing yourself with key metrics, aligning marketing strategies with financial goals, and continuously analyzing ROI, you can ensure that your marketing efforts are driving business growth and profitability.
Master the Metrics
- Gross Revenue, Net Revenue, COGS, Gross Profit, and Operating Profit: These metrics provide a comprehensive view of the business's financial health and the effectiveness of your marketing strategies.
- Operating Expenses: Effective management of marketing and other operating expenses is crucial for maintaining profitability.
Know the Benchmarks
Industry-specific benchmarks for marketing spend as a percentage of net revenue can guide budgeting and financial planning decisions. These benchmarks help ensure that marketing investments are aligned with industry standards and contribute positively to the bottom line.
Communicate and Collaborate
Regular communication with the finance team and a strong understanding of financial reports can enhance your ability to make informed decisions and develop effective marketing strategies.
Conclusion
Reading a P&L statement is a powerful skill set for marketers, providing insights into the financial health of a business and the impact of marketing efforts. By understanding key metrics, aligning marketing strategies with financial goals, and continuously analyzing ROI, marketers can drive business growth and profitability. Invest in financial literacy to make more informed decisions and develop more effective marketing strategies.
Questions readers ask
What are the key components of a P&L statement that marketers should focus on?
Marketers should pay close attention to gross revenue, returns/refunds, discounts, and net revenue. These components provide a clear view of the financial impact of marketing efforts and help in evaluating the success of campaigns.
How can understanding a P&L statement help in optimizing the marketing budget?
By analyzing the P&L statement, marketers can identify which campaigns or channels are driving the most revenue and which are not performing well. This information allows for more informed decisions on where to allocate or reallocate budget for better financial outcomes.
Why is net revenue an important metric for marketers in a P&L statement?
Net revenue is a crucial metric as it reflects the actual income generated after accounting for returns, refunds, and discounts. By tracking net revenue, marketers can assess the true financial impact of their strategies and make data-driven decisions to improve profitability.
How can marketers use P&L analysis to align their strategies with business objectives?
By regularly reviewing the P&L statement, marketers can ensure that their strategies are contributing to the overall financial goals of the business. This alignment helps in setting realistic targets, optimizing resource allocation, and demonstrating the tangible benefits of marketing efforts to stakeholders.
What role do returns and refunds play in a marketer's P&L analysis?
Returns and refunds are important indicators of customer satisfaction and can significantly impact the bottom line. Marketers need to monitor these metrics to understand the effectiveness of their campaigns and make necessary adjustments to reduce refunds and enhance overall profitability.
How does understanding the P&L statement help in evaluating the effectiveness of marketing campaigns?
By examining the P&L statement, marketers can directly link their campaign expenditures to the revenue generated. This allows for a clear assessment of which campaigns are performing well and which need improvement, enabling better future planning and resource allocation.
Can P&L analysis help in forecasting future marketing performance?
Yes, P&L analysis provides historical data that can be used to identify trends and patterns. This information is invaluable for forecasting future performance, setting realistic financial targets, and making proactive adjustments to marketing strategies to drive continued growth.
Recent articles
Fresh deep dives from the latest Reels we unpacked.




Comments
Be the first to comment.