Polling a Divided Midway
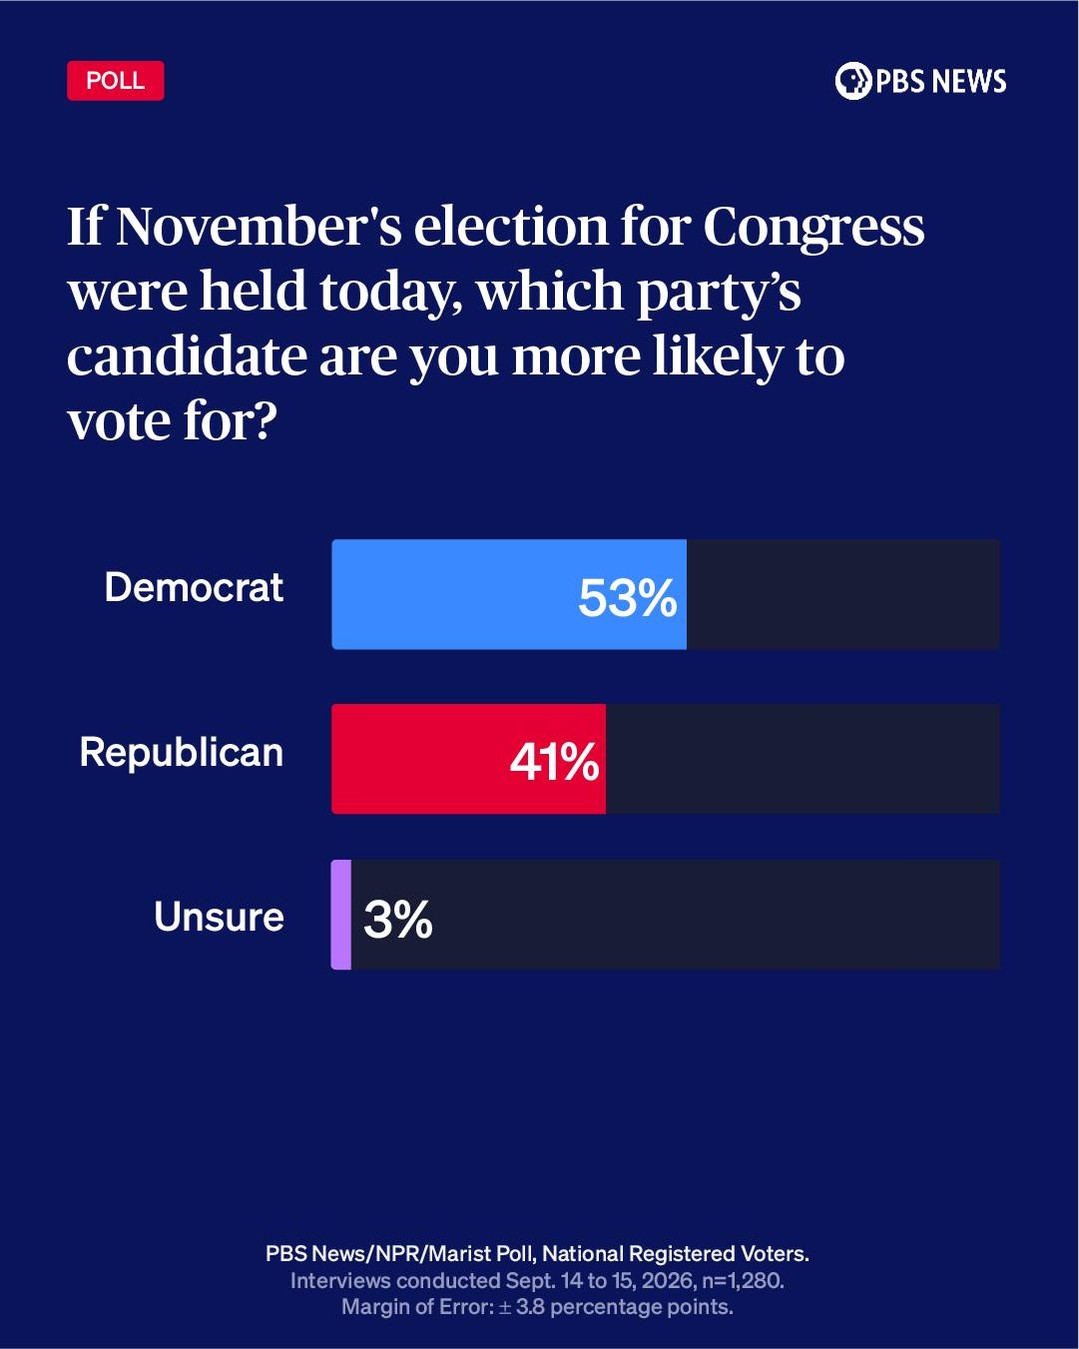
Discounting the undecided, 53% and 41% are distinct camps, "crabbing vigorously", according to The Atlantic's James *Cope. Near the verge of the upcoming Congressional election, PBS News/NPR/Marist conducts a poll to identify where voter support leans. They highlight that 53% of registered voters lean towards the Democrat candidate, 41% towards the Republican, and a notable 3% remain unsure. The poll was conducted over September 14 to 15, 2026 with a sample size of 1,280 people with a margin of error of ± 3.8%. In these times, where political views tend to be divisive and views are more polarized than ever, there is something to be said about the 3% that remains on the fence.
What is a Political Poll?
A political poll is essentially a survey that seeks to understand the preferences and opinions of voters on political issues. They reveal the pulse of public sentiment, guiding campaigns and informing public discourse. The method behind a political poll here involves asking a sample of registered voters which party they are most likely to support in an upcoming election. This survey effectively gauges voter sentiment, offering insights on which political candidates and parties voters lean towards, influencing strategy in political campaigns.
Polling Power in the Midterm Elections
Political polls play a pivotal role in shaping public perception and political strategy. They provide a snapshot of voter sentiment, influencing how campaigns are run and how resources are allocated. How voters respond to polls can shift the dynamics of an election. In a political landscape where every percentage point counts, these poll results provide a significant marker. For the midterm elections, it is indicative of the political climate of the time where even a slight push can influence current and future governmental decisions. Political polls are more than just numbers; they reflect the underlying currents of public opinion, shaping the narrative and influencing the outcomes. They help assess the potential outcomes of an election, and even may help predict future trends in voting behaviour.
How Polls are Executed
The survey specifically asks, “If November’s election for Congress were held today, which party’s candidate are you more likely to vote for?”. Here the answer choices are Democrat, Republican, and Unsure. This survey is conducted via interviews with nationally registered voters. The sample size of 1,280 interviews indicates a focus on gathering a broad, representative sample of voter opinions.
Poll Sampling for Accuracy
A sample size of 1,280 respondents is a crucial aspect of a reliable political poll in estimating the general population’s opinion. It's large enough to reduce the margin of error, providing a more accurate reflection of the public sentiment. The margin of error here of ± 3.8 percentage points means that the reported figures could vary by that amount.
What's Being Asked, And What's the Response
The question posed to participants involves a single choice “If November’s election for Congress were held today, which party’s candidate are you more likely to vote for?”. This directly addresses voter intention, yielding responses of 53% for the Democrat candidate, 41% for the Republican, and 3% who are undecided. This clear query ensures participants focus on their current voting leanings, providing a straightforward measure of political sentiment.
The Impact of the Undecided
The 3% of undecided voters in the poll adds an intriguing element to the political landscape. These undecideds may not be entirely detached, but are aligned with neither of the leading parties, showing a significant level of ambivalence. They could disrupt a close race and could be the deciding factor in swing districts or even affect the entire election. They could also potentially sway to either party, depending on who gets to them first, thus indicating a neutral influence over the final outcome of the election.
Casting Your Vote
Realistically, the undecided 3% have some time to navigate their decision. To make an informed decision based on the polls, here are a few tips:
- Engage with Campaign Issues: Beyond party affiliation, understand the specific issues each candidate promotes. Look for debates, policy papers, and news coverage that delve into these topics
- *Campaign Bulletins: Often, candidates release bulletins detailing their plans and perspectives. Subscribing to these can help you make a more informed decision.
- Analyze Past Voting Records: Voters might consider a candidate's past actions, and opinions when making their decision. Check the candidate’s records and the effectiveness of their past actions
- Listen to the latest news: Stay updated with the latest polls to know the trends and latest updates regarding the candidates.
Every Vote Counts
Understanding and analyzing the political polls is an important tool to understand the viewpoints of a majority as well as minorities in the public. The will of the people is an important factor in the political ecosystem and the Democratic community as well as Republicans rely on this will to run a successful campaign. Political polls are a simplified version of the preferences of a common person and hence play a sizable role in the entire election process.
Questions readers ask
What does it mean when 53% of voters lean towards the Democrats and 41% towards the Republicans in a political poll?
This means that if the election were held at the time of the poll, a majority of voters (53%) would likely vote for the Democratic candidate, while a significant portion (41%) would likely vote for the Republican candidate. The 3% who are unsure could sway the outcome depending on how they ultimately decide. These numbers give a snapshot of voter sentiment and can influence how campaigns strategize and allocate resources.
How does a margin of error of ± 3.8% affect the interpretation of the poll results?
A margin of error of ± 3.8% means that the actual percentages could be 3.8% higher or lower than the reported figures. So, while 53% lean towards the Democrats, the actual figure could be as low as 49.2% or as high as 56.8%. Similarly, the 41% leaning towards Republicans could range from 37.2% to 44.8%. This range is important to consider when interpreting the poll's significance and potential impact on the election.
How did PBS News/NPR/Marist gather the data for this poll?
The poll was conducted through interviews with 1,280 nationally registered voters over September 14 to 15, 2026. Participants were asked a straightforward question about their voting preferences, and their responses were analyzed to determine the overall leanings of the electorate. The sample size was chosen to provide a broad, representative view of voter opinions with a margin of error of ± 3.8%.
Why are the 3% of undecided voters significant in this poll?
The 3% of undecided voters are significant because they represent a small but potentially pivotal group. In a closely divided election, even a small shift in voter sentiment can change the outcome. The campaigns will likely target these undecided voters with tailored messages and resources to secure their support, making this group crucial in the final results.
How do political polls influence the strategies of political campaigns?
Political polls provide valuable insights into voter sentiment, helping campaigns understand where they stand and how to allocate their resources. For example, if a poll shows a candidate trailing, the campaign might adjust its messaging, increase advertising, or focus on specific issues to sway voters. Polls also help campaigns identify key demographics and regions to target, which can be crucial in tight races.
Related deep dives
Similar reads based on topic and creator.




Recent articles
Fresh deep dives from the latest Reels we unpacked.




Comments
Be the first to comment.